
In some districts, Gillani said, existing school boundaries are so gerrymandered that they “exacerbate” segregation, forcing students to travel farther in order to attend schools with children of their own race. Those instances made it easy for a computer to draw a more efficient and integrated map.
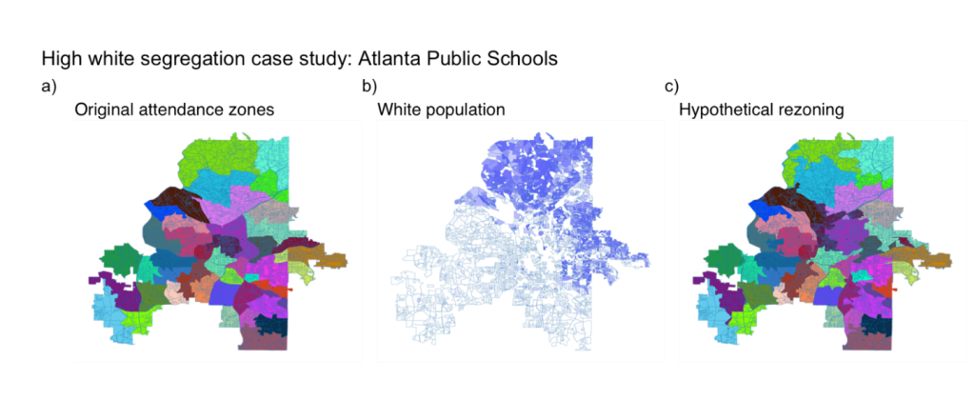
To be sure, much longer bus routes would be required for a more dramatic reduction in segregation because students would have to travel deeper into white, Black or Hispanic enclaves. But in an effort to appeal to families, Gillani and his colleagues constrained student travel times from lengthening by more than 50 percent, say, from 10 to 15 minutes. This travel constraint meant that in Atlanta, for example, a city that is divided between white residents in the north and Black residents in the south, racial integration would improve more in the middle of the city and less at its northern and southern areas.
To measure how well their redrawn maps desegregated schools, Gillani’s team calculated how 98 school districts fared on a dissimilarity index, a 0-to-1 scale of how evenly white students are distributed among schools. Zero (0) means no segregation; all students go to a school that exactly mirrors the composition of the district. One (1) means complete segregation. Imagine a town that’s half white and half Black with only two schools. If one school is all white and the other is all Black, that’s a 1. The 12 percent reduction in segregation that the computer scientists achieved in the simulation meant that 98 school districts, on average, improved from 0.39 to 0.33 on this index. However, this is an average and some districts remained quite close to 1, severely segregated.
“It’s not a huge change, but it’s still a movement towards something that’s more integrated,” said Gillani. To accomplish this relatively modest degree of desegregation, roughly 20 percent of the three million elementary school students in these 98 districts would need to switch schools.
Gillani’s tool directly redraws school boundaries based on children’s races. But a 2007 Supreme Court decision, Parents Involved in Community Schools v. Seattle School District No. 1, limited the ability of districts to consider race when they are voluntarily integrating schools. (By contrast, race can and must be considered when complying with desegregation court orders.) Today many districts that seek to desegregate have switched to using socio-economic proxies for race, such as family income. Gillani said he could adjust the map-drawing tool to optimize for socio-economic diversity instead.
As part of this work, Gillani and his colleagues created the website www.schooldiversity.org where anyone can see how elementary school boundaries could improve in 4,000 districts. That’s nearly every district in the nation that has more than one elementary school. At the moment, the publicly visible tool is limited to seeing current boundaries and how they could change under one set of conditions: maximizing racial integration while limiting travel time increases to 50 percent and school size increases to 15 percent.
When I looked up my childhood school district of Simsbury, Connecticut, it was interesting to see the proposed changes. One school with a higher percentage of Black and Hispanic children was literally halved in size in order to spread those students around to the predominantly white schools. It would become a tiny school of fewer than 150 students – not economically practical.
Gillani said he intends to release his code and datasets, allowing other researchers and school districts to explore other parameters and make their own tradeoffs. That is expected to happen later in 2022, when his paper, “Redrawing attendance boundaries to promote racial and ethnic diversity in elementary schools,” currently under peer review at an academic journal, is published.
Akeshia Craven-Howell told me she wishes her community could have had access to a tool like this when she was an associate superintendent in Charlotte-Mecklenburg Schools in North Carolina, where she was involved in redrawing school boundaries, before she left in April 2022 and joined Bellwether Education Partners, a consulting firm.
“What we lacked was a transparent way for the community to see how boundaries could change under different scenarios,” said Craven-Howell.
“I think it can be helpful to show what’s possible,” Craven-Howell said. “It’s a powerful tool for community engagement. But a lot of messaging and communications work has to happen alongside it. We need to be giving families the confidence that their children will benefit, not just in social ways, but also in academic ways.”
Ultimately, segregation is a knotty political, cultural and social problem. Gillani and his co-authors recognize their technocratic approach isn’t “sufficient” to drive policy change in the face of parents who oppose integration. But, they wrote, “it may help illuminate possible paths to integration ‘within reach’ that both districts and families may not have previously explored.”