
[ad_1]

wutzkohphoto // Shutterstock
Comparing states with the highest and lowest personal debt and income levels
Americans collectively owe more than $15.3 trillion in personal debt, accrued by financing homes and cars, taking out loans to attend college, or simply by using credit cards. Debt isn’t necessarily a sign of borrowers living beyond their means or buying irresponsibly, though. It’s often used as a tool to achieve financial goals that can have long-term benefits, such as buying a home to build equity over many years. Debt and income profiles of every state vary significantly when factors such as housing prices, cost of living, and economic opportunities are considered.
While not a factor in credit scores, lenders consider the balance between an applicant’s debt and personal income when deciding to approve applications for credit and when setting terms on the account, like interest rates. The more of your income used to pay off debt, the more difficult it might be to get approved.
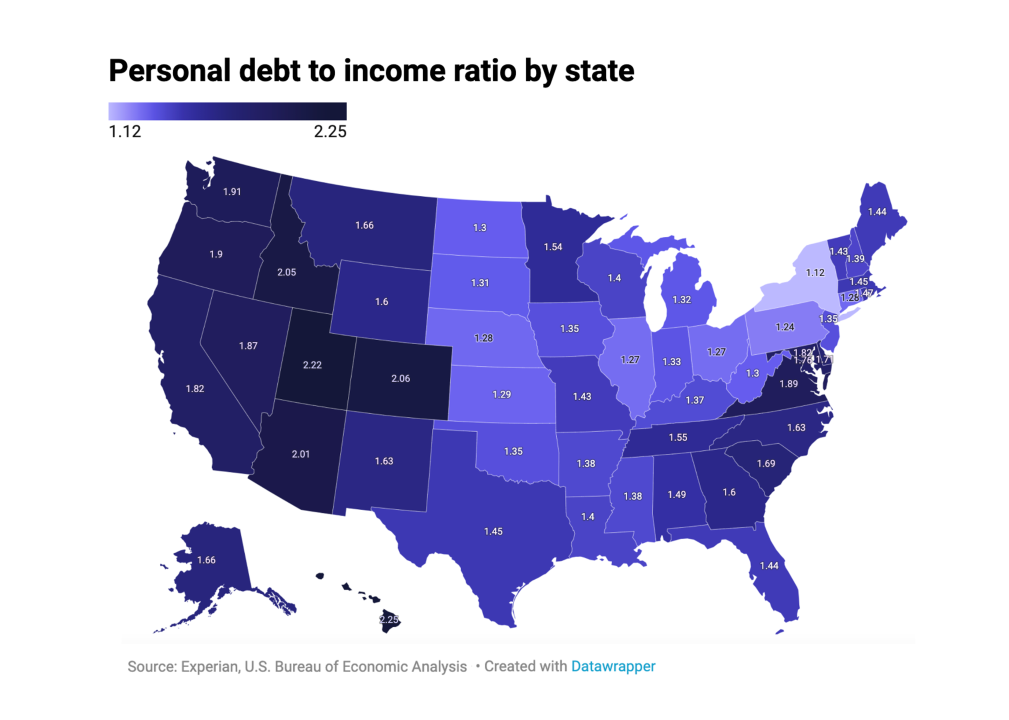
Experian compared data from its consumer credit database with Bureau of Economic Analysis (BEA) statistics to calculate the states with the highest and lowest ratios of personal debt to income. Average personal income figures are from the BEA, while personal debt balances are derived from Experian’s consumer credit database as of the third quarter (Q3) of 2021. In addition, trends in homeownership, student loan debt, auto and payday loans, credit card utilization, and wages are used to contextualize each state’s debt profile.
There are many factors at play when discussing debt profiles, however, and not all of them can be included in this analysis. For instance, the ratio between personal debt and income levels fails to capture the complete financial picture of “credit invisibles”—45 million Americans with insufficient or no credit—as well as systemic disparities in lending practices.
In addition to the ever-present influences on both debt and income, the pandemic highlighted the different financial realities for people across the country. While many lost their jobs or suffered financial hardships, others found their situations improved. States inlcuding Idaho and Utah, with burgeoning economies and record-setting real estate growth, are perfect examples of the widening economic gap: While Americans in some states were buying dream homes and driving a local economic boom, others elsewhere were struggling to get by.
![]()
Experian
National figures
Where you live can significantly impact your debt load. To illustrate the differences between states, particularly those with the highest and lowest ratios of personal income and debt, we’ve listed the national debt averages for mortgages, student loans, auto loans, and credit cards for individuals with each debt type. For Americans who carry mortgages, their home financing debt is more than 10 times the amount of the average auto loan. That mortgage number can climb drastically if the state has a competitive housing market and strong economy—two major factors that can determine how much individuals need to borrow to afford a home. The more expensive the state, the more debt load they may have to take on to live there.
-Ratio of personal debt compared to income: 1.50
– Average personal income: $62,866
– Average personal debt: $94,321
Average debt among those who hold debt in each category:
– Average mortgage: $220,294
– Average student loans: $39,487
– Average auto loans: $20,987
– Average credit card: $5,878

Canva
Highest: #1. Hawaii
– Ratio of personal debt compared to income: 2.25
– Average personal debt: $138,274
– Average personal income: $61,549
Hawaiians have the third highest-average personal debt behind residents of Washington D.C. and Colorado. Hawaii’s cost of living is high—93% greater than the national average and the highest in the country in 2021—and personal income on the island state is only slightly higher than the national average. In 2021, a survey by the Hawaii Journal of Health and Social Welfare found that the pandemic hit the tourism economy of the state hard. It found that 73% of respondents considered themselves financially vulnerable, with more than 29% reporting that they live paycheck to paycheck.

Canva
Highest: #2. Utah
– Ratio of personal debt compared to income: 2.22
– Average personal debt: $122,474
– Average personal income: $55,229
Utah has the fastest-growing economy in the U.S., according to the Bureau of Economic Analysis, with annual GDP soaring by more than 30% over the last decade—an increase of roughly $45 billion since 2010.” This economic expansion—combined with an influx of families, young professionals, and out-of-state migrants—has been a boon to the housing industry, with median single-family home prices reaching $435,000 in 2021—about $88,000 more than the national median. Utah ranks 12th in the nation for average mortgage debt.

Arina P Habich // Shutterstock
Highest: #3. Colorado
– Ratio of personal debt compared to income: 2.06
– Average personal debt: $140,327
– Average personal income: $68,106
Residents of Colorado have the second-highest overall personal debt load in the country behind Washington D.C. The majority of the debt load stems from mortgages and skyrocketing real estate prices. In Denver, home prices rose nearly 20% in 2021. Among Colorado residents who carry a mortgage, the average mortgage debt amount is $295,000—the fifth-highest average in the country.

Robert Seibel // Shutterstock
Highest: #4. Idaho
– Ratio of personal debt compared to income: 2.05
– Average personal debt: $104,944
– Average personal income: $51,204
Known as the Gem State, Idaho is a hidden treasure no longer. Even before the pandemic gave some remote workers the flexibility to relocate and work from anywhere, Idaho was the fastest-growing state in the country. The state netted more than 53,000 new residents from 2020 to 2021 alone, according to U.S. Census Bureau estimates. Much of Idaho’s debt is in housing—not surprising, perhaps, considering the state has one of the highest homeownership rates in the country at nearly 72%. Home prices soared by 32.2% in Idaho between 2020 and 2021—the biggest increase of any state. Despite Idaho having the 15th highest average personal debt load, it has one of the lowest average personal income rates in the country.

Tim Roberts Photography // Shutterstock
Highest: #5. Arizona
– Ratio of personal debt compared to income: 2.01
– Average personal debt: $103,326
– Average personal income: $51,381
Home prices in Arizona rose 29.5% between 2020 and 2021. In Phoenix, the state’s capital and largest city, prices rose by 30%—more than any other city in the country. Over that same period, the cost of living in the Phoenix region increased by nearly 10%. In January 2022, Arizona raised the minimum wage to $12.80 to track with increases in the consumer price index. Still, Arizona ranks among the bottom ten states with an average personal income roughly $9,000 lower than the national average.

T photography // Shutterstock
Lowest: #1. New York
– Ratio of personal debt compared to income: 1.12
– Average personal debt: $87,353
– Average personal income: $78,252
New York’s remarkably low personal debt to income level ratio is not exactly what it seems. Roughly 43% of the state’s population lives in New York City, one of the most expensive places in the world to reside—the cost of living is so high that most residents can’t afford to accrue debt by purchasing things like homes and cars. At 54.2%, New York has the second-lowest homeownership rates in the country behind Washington D.C. The state has the fourth-highest average personal income—more than $17,000 more than the national average, but that varies drastically across the state itself. According to the Bureau of Labor Statistics, the average weekly wages in Manhattan were more than double that of many of the largest counties upstate.

LapaiIrKrapai // Shutterstock
Lowest: #2. Pennsylvania
– Ratio of personal debt compared to income: 1.24
– Average personal debt: $79,686
– Average personal income: $64,514
Pennsylvania has one of the highest shares of low-wage earners, but the state’s economy has been one of the slowest to recover from the pandemic. In 2020, personal consumption expenditures—or spending on goods and services like cars, groceries, and house cleaning—decreased by 4% in Pennsylvania, according to the BEA. The state also saw one of the largest population decreases between July 2020 and 2021, with 25,569 residents leaving the state. Homeownership rates, on the whole, are also expected to decline over the next two decades, with Black and Hispanic homeownership rates most severely impacted.

Canva
Lowest: #3. Ohio
– Ratio of personal debt compared to income: 1.27
– Average personal debt: $70,747
– Average personal income: $55,842
In every major debt category, residents of Ohio carry less debt than the national average. Notably, the average mortgage balance in Ohio is nearly $73,000 less than the national average, making it the third-lowest in the country. However, the state has one of the highest rates of bankruptcy filings due to slow economic recovery from the 2008 recession and unemployment rates above the national average. Despite the state’s slow economic expansion, the state is making progress toward closing the racial homeownership gap. Ohio is projected to be one of the top 10 states with the most significant growth in homeowners of color by 2040, according to the Urban Institute’s Housing and Finance Report.

marchello74 // Shutterstock
Lowest: #4. Illinois
– Ratio of personal debt compared to income: 1.27
– Average personal debt: $85,991
– Average personal income: $67,655
Among consumers in Illinois, 1 in 10 has filed for bankruptcy, making the state one of the highest in the country for both bankruptcy filings and the average amount of debt that gets erased. Illinois’ housing sales and prices, already on a low and slow trajectory prior to the pandemic, seem to have been skipped over by the real estate explosion of the past several years. Personal income growth in Illinois has also stagnated, increasing by just 1.1% since the Great Recession of 2007. Mississippi was the only state that experienced slower income growth.

Canva
Lowest: #5. Nebraska
– Ratio of personal debt compared to income: 1.28
– Average personal debt: $79,916
– Average personal income: $62,432
Nebraskans’ low cost of living and robust job market are two big reasons why debt levels are comparatively low compared to the rest of the country. Unlike some states with sluggish economies, Nebraska has one of the lowest unemployment rates in the country at 1.7%. Even with a strong job market, it still manages to be one of the most affordable places to live. The median home sale price in Nebraska at the end of 2021 was $246,000, according to Redfin. Homeowners in the state carry some of the lowest average mortgage balances at $153,621, more than $50,000 less than the national average.
This story originally appeared on Experian
and was produced and distributed in partnership with Stacker Studio.
[ad_2]
Source link