Kaandorp, M.L.A., Lobelle, D., Kehl, C. et al. Global mass of buoyant marine plastics dominated by large long-lived debris. Nat. Geosci. 16, 689–694 (2023). https://doi.org/10.1038/s41561-023-01216-0
*********************
The mystery of what happens to plastics in our oceans has kept us scratching our heads for quite a while. Recent calculations on how much plastic enters the ocean have blown our minds, showing numbers one to two orders of magnitude bigger than the plastic we actually see bobbing on the surface. Maybe we’ve been a bit too generous in estimating how much plastic is going in, or perhaps the ocean has a secret cleaning crew, or maybe the plastic is just turning into little plastic bits too tiny for us to spot. But fear not, for Dr.s Kaandorp et al. bring in a grand solution in 3D. They have gathered data from all corners of the ocean – coastlines, surface waters, and the deep abyss – and put it into a fancy computer model, taking into account plastic bits ranging from speck-sized to sofa-sized.
Source: Phys.org | Aug 2023.
And guess what they found? Those big, showy plastics (>25 mm) are the true divas of the marine plastic scene, strutting their stuff and accounting for over 95% of the initial plastic mass – a whopping 3,100 out of 3,200 kilotonnes for the classy year of 2020. Their computer whirred and calculated, and it seems we might have overestimated how much plastic is taking the plunge annually, with a modest 500 kilotonnes making the dive.
So, here’s the scoop: they think they have cracked the case on where all that plastic is hiding. It’s not sneaking off to some secret hideaway; it’s right there, swirling and lurking. And what’s more, their calculations show that these plastic party crashers are overstaying their welcome in the ocean, just like those guests who won’t leave your house after a party. This never-ending plastic bash could spell trouble for ocean ecosystems if we don’t start showing these plastic troublemakers the exit with some clever strategies.
Okay, let’s get more serious.
The surface of the global ocean currently holds an estimated 250 million kilograms (250 metric kilotonnes) of plastic pollution. However, a considerably larger volume of plastic pollution, approximately 800 to 2,400 kilotonnes from rivers and 4,800 to 23,000 kilotonnes from coastal regions, is believed to enter the ocean each year. This discrepancy between estimated plastic input and observed floating plastic mass prompts a comprehensive investigation into the underlying causes.
To address this disparity, a sophisticated three-dimensional (3D) global transport model for marine plastics has been developed, incorporating extensive observational data. This dataset includes measurements of plastic concentrations in terms of both quantity (number of plastic pieces per unit volume) and mass (grams of plastic per unit volume). The dataset encompasses 14,977 measurements from surface waters, 7,114 measurements from beaches, and 120 measurements from the deep ocean. Additionally, 2,303 beach measurements provide insight into the proportion of fishing-related plastic items.
Source: ACS | Aug 2020.
In this study, the complexity of previous mass budget analyses is enhanced by introducing various models that account for different processes influencing the transport of marine plastics. These processes include sinking due to biofouling, beaching, turbulent vertical mixing, and fragmentation. Utilizing a Bayesian approach, the model aligns well with observed plastic concentrations across diverse marine environments and size categories, as well as with current understanding of processes that remove plastic from the ocean’s surface.
It is found that the sinking of plastic particles, triggered by biofilm growth, is a significant contributor to the removal of plastic mass from surface waters. The investigation suggests that a substantial portion (67-77%) of plastics resides within coastal waters or on beaches located up to 10 kilometers offshore. To account for this, models for beaching and resuspension of plastics back into the ocean are integrated. Additionally, the hypothesis that the mixing of plastic particles within the water column might explain the relatively low estimates of plastic mass obtained from surface net trawls is addressed. This is achieved by incorporating a three-dimensional representation of plastic transport, which includes the modeling of vertical turbulent mixing in the water column.
A recently developed fragmentation model is also incorporated, considering a range of plastic particle sizes from 0.1 to 1,600.0 millimeters. This enables the assimilation of various types of observations, such as net trawls capturing microplastics (<5 millimeters) and measurements of larger plastics (>25 millimeters) from shipboard observations and beach clean-ups. This comprehensive size spectrum allows for a more accurate connection between the concentration of plastic particles and the corresponding plastic mass.
The focus remains on plastics that are initially buoyant upon entering the marine environment, specifically polyethylene, polypropylene, and polystyrene. These polymers are known to constitute the majority of plastic items found in the ocean’s surface layers, deeper layers, and beaches. Polymers denser than seawater, such as polyvinyl chloride and polyethylene terephthalate, are excluded from consideration, as they are estimated to comprise approximately 35-40% of the plastic mass entering the marine environment.
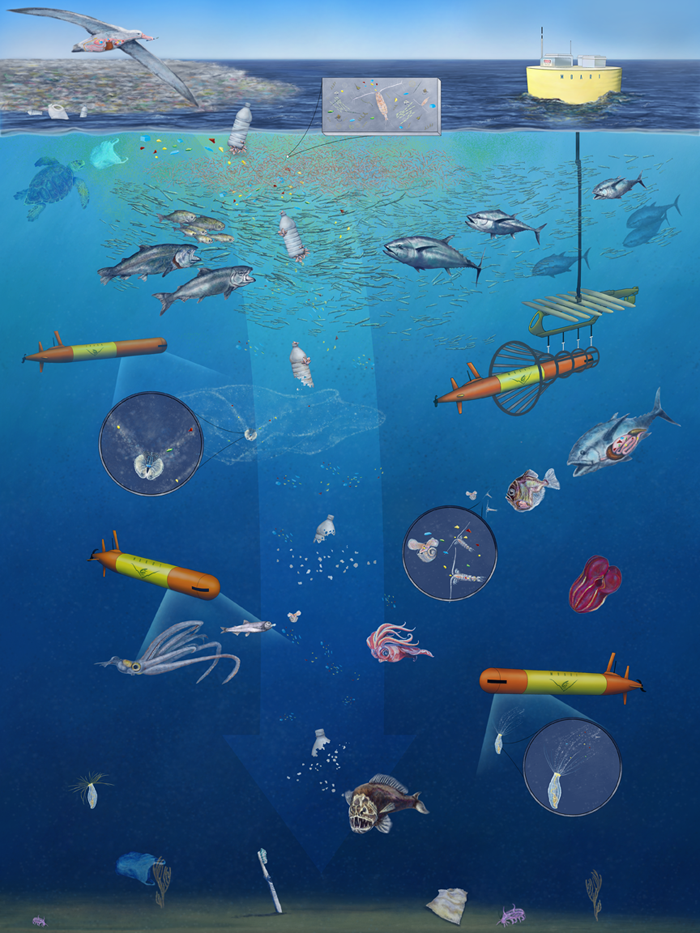
Source: MBARI | June 2019
Krti is interested in the transmission dynamics of environmental diseases as they relate to climate and anthropogenic stressors. As a Fulbright Scholar, Krti conducted analyses on the responses of dengue fever to climatic stressors off the coast of the Bay of Bengal, in India. Currently, Krti works with Stanford University to understand the role of schistosomiasis in environmental reservoirs, and leads the pursuit of a computational-based based analysis of eelgrass wasting disease dynamics. At Stanford, Krti serves as one of the few trans-disciplinary experts for planetary health topics, via machine learning and computer vision, data science, environmental policy, and science communication. As a STEM innovator and a first-generation woman of color, Krti is proud to be a writer for Oceanbites!


